Which Topics Got More Engagement on Medium? A Study of 4.9 Million Stories
Personal stories and creative writing led the raw numbers. Comparing the same authors changed the picture.
I wanted to know whether data could help me make better decisions about what to write on Medium. My own interests are finance, technology and AI, but starting with those subjects would have skipped a more basic question: what kinds of stories attracted engagement across the platform?
I analysed nearly 4.9 million stories. Personal experience, humour and creative writing had much stronger raw engagement than broad technology and business subjects. The more useful finding came afterwards: some of those differences became much smaller when I compared work by the same writers in similar circumstances.
That changes what I would do with a list of supposedly successful niches.
The source is Fabian Ridder's public Medium dataset on Kaggle. After cleaning and validating story identifiers, the database contained 4,890,576 distinct stories. Forty lacked usable clap values, leaving 4,890,536 stories by 908,758 authors for this overview.
The uploader collected the data between 2 and 5 October 2023, starting with technology and trading-related tags and expanding through other tags. This is a historical crawl with a particular discovery process. It is not a random sample or a census of everything published on Medium. Although I used the full available history, 99.4% of the usable stories were dated 2022 or later. An April 2024 dataset update did not turn the underlying engagement counters into a fresh snapshot.
The data contains claps, response counts and author/publication information. It does not contain the private views, reads or earnings needed to answer the question I ultimately care about: which writing decisions help me earn more?
For this first analysis, “performance” therefore means observed public engagement.
Most stories had very little of it. Across the usable dataset, 60.3% had zero claps. Only 10.9% reached 100 claps, while 13.9% had at least one recorded response among stories with a usable response counter.
I used the share reaching 100 claps as a readable comparison measure, alongside median claps and responses. That threshold sits near the observed upper tenth: the dataset's 90th percentile was 104 claps. It is a descriptive cutoff, with no established connection to earnings. Claps also do not measure unique readers.
For the main tag comparison, I required at least 5,000 stories and 500 authors. That left 552 supported tags. The selection below spans personal writing, creative work and technical/business subjects; it is not a list of the top eleven tags.
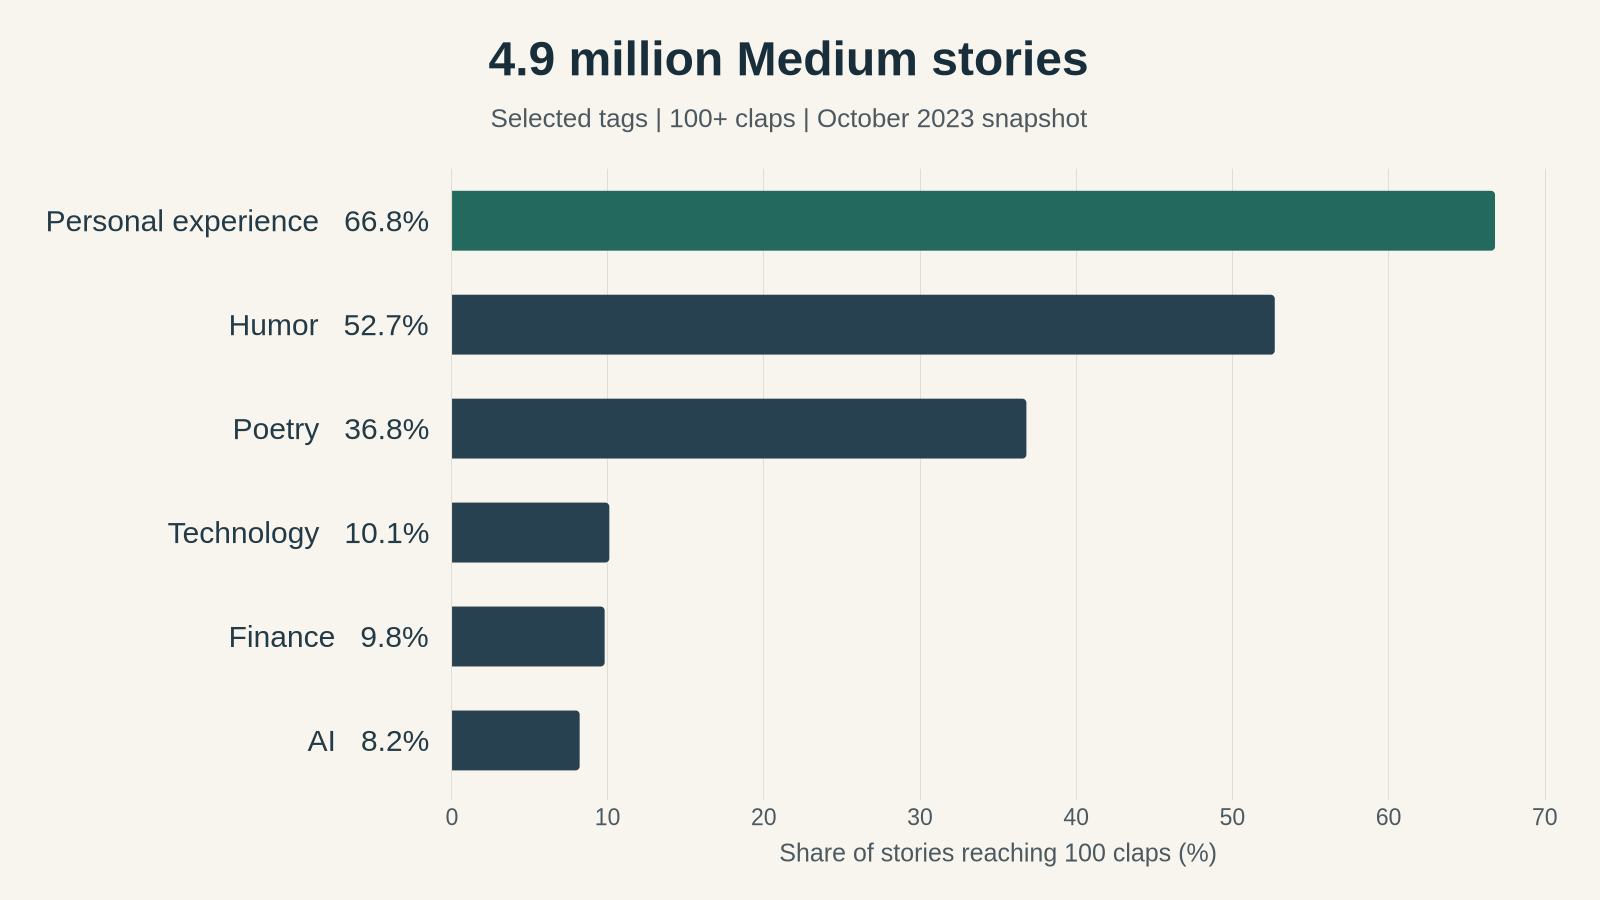
Chart: selected tags from my analysis of Ridder’s historical dataset. Tags overlap; this is a selection, not a full ranking.
- This happened to me: 20,141 stories; 66.8% reached 100 claps; 71.2% had at least one response.
- Satire: 11,247 stories; 61.0% reached 100 claps; 64.2% had at least one response.
- Memoir: 7,039 stories; 59.8% reached 100 claps; 63.8% had at least one response.
- Humor: 34,578 stories; 52.7% reached 100 claps; 56.5% had at least one response.
- Poetry: 111,627 stories; 36.8% reached 100 claps; 35.3% had at least one response.
- Relationships: 94,550 stories; 27.1% reached 100 claps; 31.5% had at least one response.
- Travel: 70,345 stories; 17.4% reached 100 claps; 21.1% had at least one response.
- Technology: 178,943 stories; 10.1% reached 100 claps; 13.6% had at least one response.
- Finance: 52,506 stories; 9.8% reached 100 claps; 14.0% had at least one response.
- AI: 130,951 stories; 8.2% reached 100 claps; 12.3% had at least one response.
- Business: 152,481 stories; 8.1% reached 100 claps; 10.7% had at least one response.
Source: my calculations from Ridder's version-2 dataset. Rates are rounded. Tags overlap, so one story can appear in several rows. Response rates exclude missing response counters; a response count is not a count of unique commenters.
The contrast is substantial. About two-thirds of stories tagged “This happened to me” reached 100 claps, compared with roughly one in ten under Finance or Technology. Poetry had a median of 50 claps; Finance, AI and Business each had a median of zero.
I would take that as evidence that personal and creative writing had active engagement communities in this collection. I would be much more cautious about telling a finance writer to switch subjects.
Some high-ranking labels are themselves connected to communities or publications. “The Power of Poetry,” “New Writers Welcome” and “ILLUMINATION” were among the raw leaders. A tag can partly describe the readers and distribution surrounding a story, rather than its subject alone.
That led to the next question: how much of the apparent topic advantage reflected the people doing the writing?
The relationship with audience size was striking. Among stories by accounts with 100–999 followers at collection, 23.2% reached 100 claps. The rate was 48.0% for accounts with 1,000–9,999 followers and 60.9% for accounts with at least 10,000.
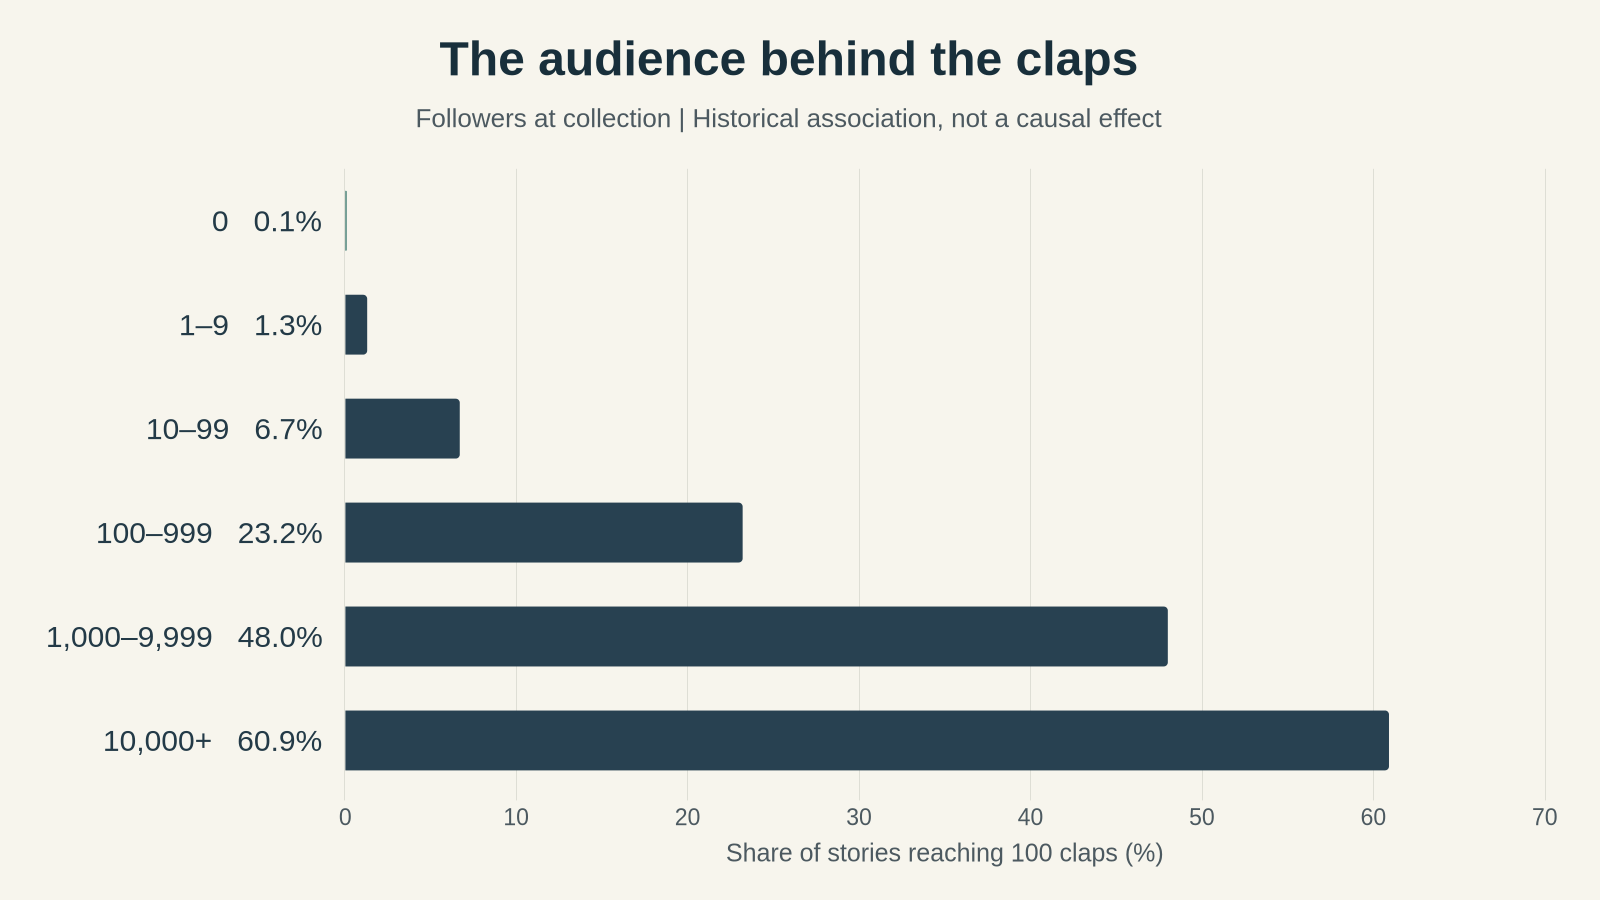
Chart: my calculations from the historical dataset. Follower counts were recorded at collection, not before each story was published. These are associations, and successful stories may themselves have helped build the observed audience.
Followers alone did not settle the comparison. I also examined publication month, publication, reading-length band and observed earlier posting activity. Those comparisons retained only groups containing both stories with a given tag and stories without it.
For humour, the gap in the share reaching 100 claps fell from 42.20 percentage points in its raw, shared-comparison subset to 9.54 points after matching that context. Personal experience moved from 57.89 points to 12.14 points. These figures describe the same eligible observations within each tag's comparison; they are not a replacement ranking of every niche.
A separate comparison went further: what happened when the same author used different tags? I compared stories within the same author, publication month, publication and length band, then gave each matched author equal weight. Missing publication IDs remained a shared unknown bucket. This uses a different subset: writers who had both tagged and untagged stories in comparable circumstances.
- Poetry: +3.91 percentage points across 7,632 matched authors (95% bootstrap range: +3.36 to +4.47 percentage points).
- Memoir: +2.17 percentage points across 974 matched authors (95% bootstrap range: +0.32 to +4.03 percentage points).
- This happened to me: +1.10 percentage points across 2,222 matched authors (95% bootstrap range: -0.02 to +2.16 percentage points).
- Humor: -0.48 percentage points across 4,336 matched authors (95% bootstrap range: -1.28 to +0.31 percentage points).
Differences are percentage points in the share reaching 100 claps. Positive means the tagged stories had a higher rate than that author's comparison stories. Ranges come from 1,000 resamples of matched authors; they do not account for the crawl's selection bias or establish causal effects.
Humour's large raw advantage was close to zero in this comparison. Poetry retained a positive association of 3.91 percentage points. Memoir also retained a smaller positive association, while the personal-experience range included zero.
These are exploratory comparisons across many tags. They do not prove that changing a story into a poem would improve it, or that adding a tag would produce the observed difference. They do show why a raw leaderboard is a weak basis for choosing my next article.
Publication context also helps explain why topic averages can mislead. Among stories with a recorded publication, 38.5% reached 100 claps, compared with 5.7% where no publication was recorded. The latter is our closest available profile-only comparison, although a missing ID does not confirm that placement.
Comparing work by the same authors in the same month and length band retained an 11.8-percentage-point gap across 20,624 writers. Also requiring identical tag sets left a 6.3-point gap across 1,884 writers in a smaller sample. Publication audience size carried additional information, but larger counters did not consistently mean stronger engagement.
This supports considering relevant publications when choosing where to submit. It does not establish the benefit caused by acceptance: editorial selection, later placement changes and historical audience measurements remain unresolved. I’ll examine publication choices in a separate follow-up.
I also checked whether the pattern differed among older and newer stories in the dataset. It did, but interpreting the changes required care.
The share of Technology stories reaching 100 claps was 17.8% for stories published in 2022 and 8.4% for those published in July–September 2023. AI moved from 16.4% to 6.9%. Humour remained relatively strong at 62.4% and 50.0%, respectively.
Those numbers do not establish that Medium's audience lost interest in those subjects. All the counters came from the October 2023 collection, so older stories generally had more time to accumulate engagement. Discovery, author mix and distribution could differ too.
I considered overall Medium traffic, but did not obtain a consistent historical traffic series for this period. Dividing a story's accumulated claps by visits during its publication month would mix incompatible time windows. The context comparisons match publication month, which helps compare stories published under similar calendar conditions, without measuring traffic itself.
One apparent topic decline also turned out to involve a changing mixture of records.
For the Books tag, 27.7% of 2022 stories reached 100 claps, compared with 4.7% of stories published in the third quarter of 2023. Looking at titles raised another possibility: the newer group contained many more records with download-related wording.
A crude title screen for terms such as “download,” “pdf” and “ebook,” alongside “keygen,” “crack” and “torrent,” matched 1.3% of the 2022 Books cohort and 48.8% of the third-quarter 2023 cohort. Excluding matching titles raised the newer cohort's 100-clap rate from 4.7% to 9.1%; the equivalent filtered 2022 rate was 28.0%.
That screen was prompted by the finding. It is not a validated spam classifier: it can exclude legitimate work and miss promotional material. Still, it exposed a problem with the easy explanation that readers had simply stopped caring about books. The label was covering a different mixture of observed records.
Posting frequency offered a similar lesson about turning correlations into advice. Stories whose authors had at least ten observed earlier posts in the preceding 30 days reached 100 claps more often than stories with none: 15.1% versus 6.8%.
When I compared articles by the same writers in similar circumstances, having another recorded article in the previous 30 days was not associated with better engagement. The share reaching 100 claps was 0.38 percentage points lower. Because the dataset misses some articles, “no earlier article recorded” does not necessarily mean the writer had been inactive.
This comparison asks whether there was at least one earlier article, rather than comparing ten posts with zero. I would not use either result to prescribe a daily posting quota.
For my own writing, the useful implication is to look for comparable examples: writers with a similar audience, publishing in similar places, addressing similar readers. A topic's average can be a starting reference, but it bundles together subject matter, community, distribution and the authors already working there.
The broad pattern is worth knowing. Personal experience and creative formats attracted much more raw engagement in this historical collection than the broad technical and business labels I initially had in mind. The author comparisons make that a more qualified finding, rather than a recommendation to abandon my interests.
I still want a system that helps me choose stronger article ideas. The next step is to test whether an assessment of a title and subtitle adds useful predictive information beyond a statistical baseline, particularly when comparing one writer's work. That needs a separate experiment with fixed inputs, a versioned prompt and held-out evaluation. Getting an AI model to return plausible scores is only the beginning of that test.
For now, this analysis gives me a better question to ask of a successful article: how much does its engagement tell me about the topic, and how much does it tell me about the writer and the audience around it?
Method note: this overview uses the complete imported Ridder version-2 history with valid claps, retaining zero-engagement stories. Response comparisons exclude missing response values. Tags are metadata labels, not independently verified themes or languages. Outcomes are accumulated counters at one historical collection, not fixed 30-day performance. Source files, checksums, analysis scripts and comparison tables are retained with the research. No income prediction or causal effect is established.